Is the Amazon Tumbler Market Still Viable? I Ran 8 Dimensions of Data with Amazon Market Deep-Dive
Every week someone DMs me: "Is the tumbler category already a red ocean? Is it too late to get in now?" I used to answer from gut and experience — but beginners have no experience, so that answer is useless to them.
This post demonstrates: not guessing, but using real data to judge "is the Amazon tumbler market still viable" across 8 dimensions. Run through it once and you can apply the same method to any category next time.
What problem this step actually solves
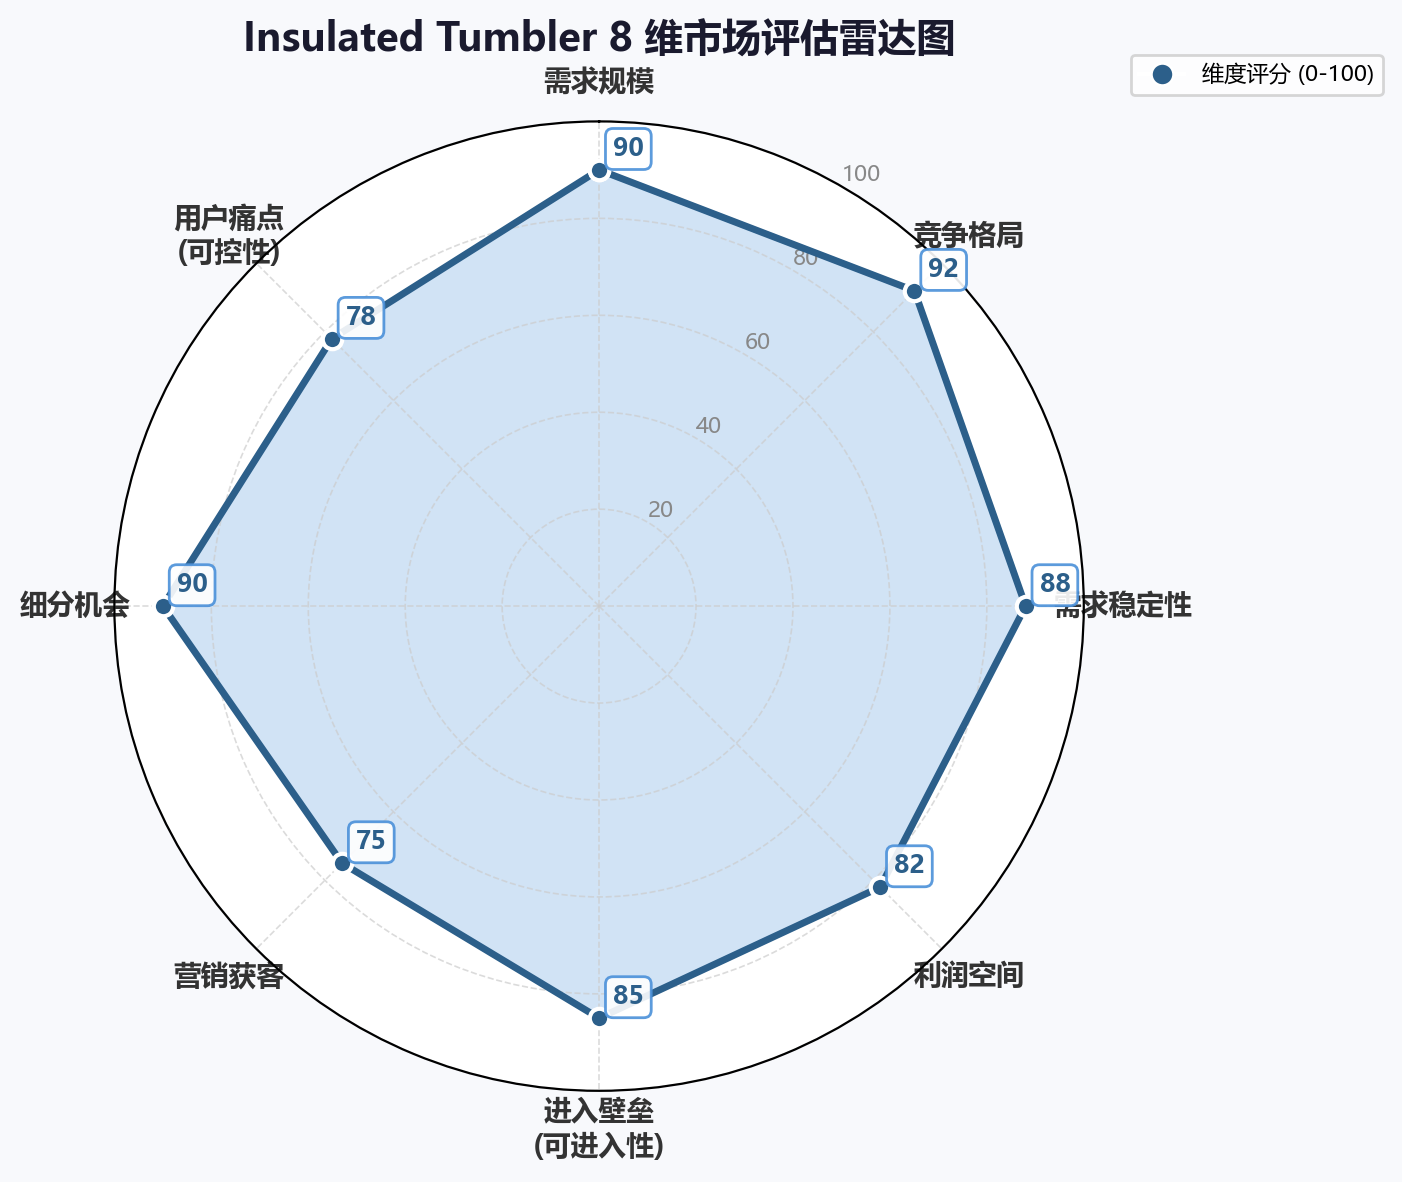
"Is the market viable" is too vague to answer directly. You have to break it into 8 specific questions, each answered with real data:
Market size
Is the pie big enough to bother?
Competition
Can you break into the first few pages?
Seasonality
Year-round or peak-season only?
Profit room
What's left after all costs?
Entry barrier
Beginner-friendly or heavy investment?
Marketing cost
Is the ad CPC high?
Blue-ocean
Any overlooked sub-niches?
Pain points
The biggest flaws in current products?
Why I stopped scrolling BSR lists to guess the market
Three years ago I judged "is the market viable" entirely by manually scrolling BSR lists, eyeballing a few top sellers' monthly sales, and calling it a number. Then I fell into countless traps — wrong market size, ignored seasonality, underestimated ad costs…
❌ Eyeballing the market from BSR
· Only the top few sellers — sample too small
· Monthly sales back-derived from BSR — huge error
· Can't see seasonality (needs historical trend)
· Data like ad CPC and Top5 share is simply unavailable
· Gut conclusions have no quantified standard
✅ Using EasyClaw's Amazon Market Deep-Dive
· Connects to the official Jungle Scout API — real data
· 8-dimension quantified analysis, each with a standard
· Auto-computes CV (seasonality coefficient)
· Outputs a complete final_report.md
· Plus ~50 product recommendations + B2B suppliers
· Total ~20 conversation turns, 10-15 minutes
Why I don't use the Jungle Scout web app — I use EasyClaw
Good question — Amazon Market Deep-Dive uses Jungle Scout's official API data anyway, so why not just subscribe to the JS web app?
🌐 Jungle Scout web app
Gives you a pile of metrics and charts
→ the "how to interpret + decide" is left to you
The biggest beginner pain:
· See "Top5 share 38%" — don't know if that's high or low
· Seasonality CV 0.32 — no idea what it means
· 8 dimensions of data mixed together — no clear conclusion
→ No matter how complete the data, beginners can't act on it
🤖 EasyClaw = "skill pulls data + 8-dimension standards + report generation"
Amazon Market Deep-Dive carries built-in quantified standards:
· Search volume >10K large, 5K-10K medium, <5K small
· Top5 share <40% low, 40-60% medium, >60% high
· CV ≤0.5 non-seasonal, >0.5 seasonal
→ After the run it tells you directly "this dimension is good/medium/bad"
→ The 8 dimensions consolidate into one final_report.md
→ Plus 50 product recommendations and B2B suppliers
This is a "decision tool" a beginner can use directly, not just a data tool.
Here's how I had EasyClaw run this pipeline
Amazon Market Deep-Dive is a composite skill — not a single action but a pipeline: call APIs → compute metrics → run 8-dimension analysis → recommend products → find suppliers → produce a report. The actual steps are two:
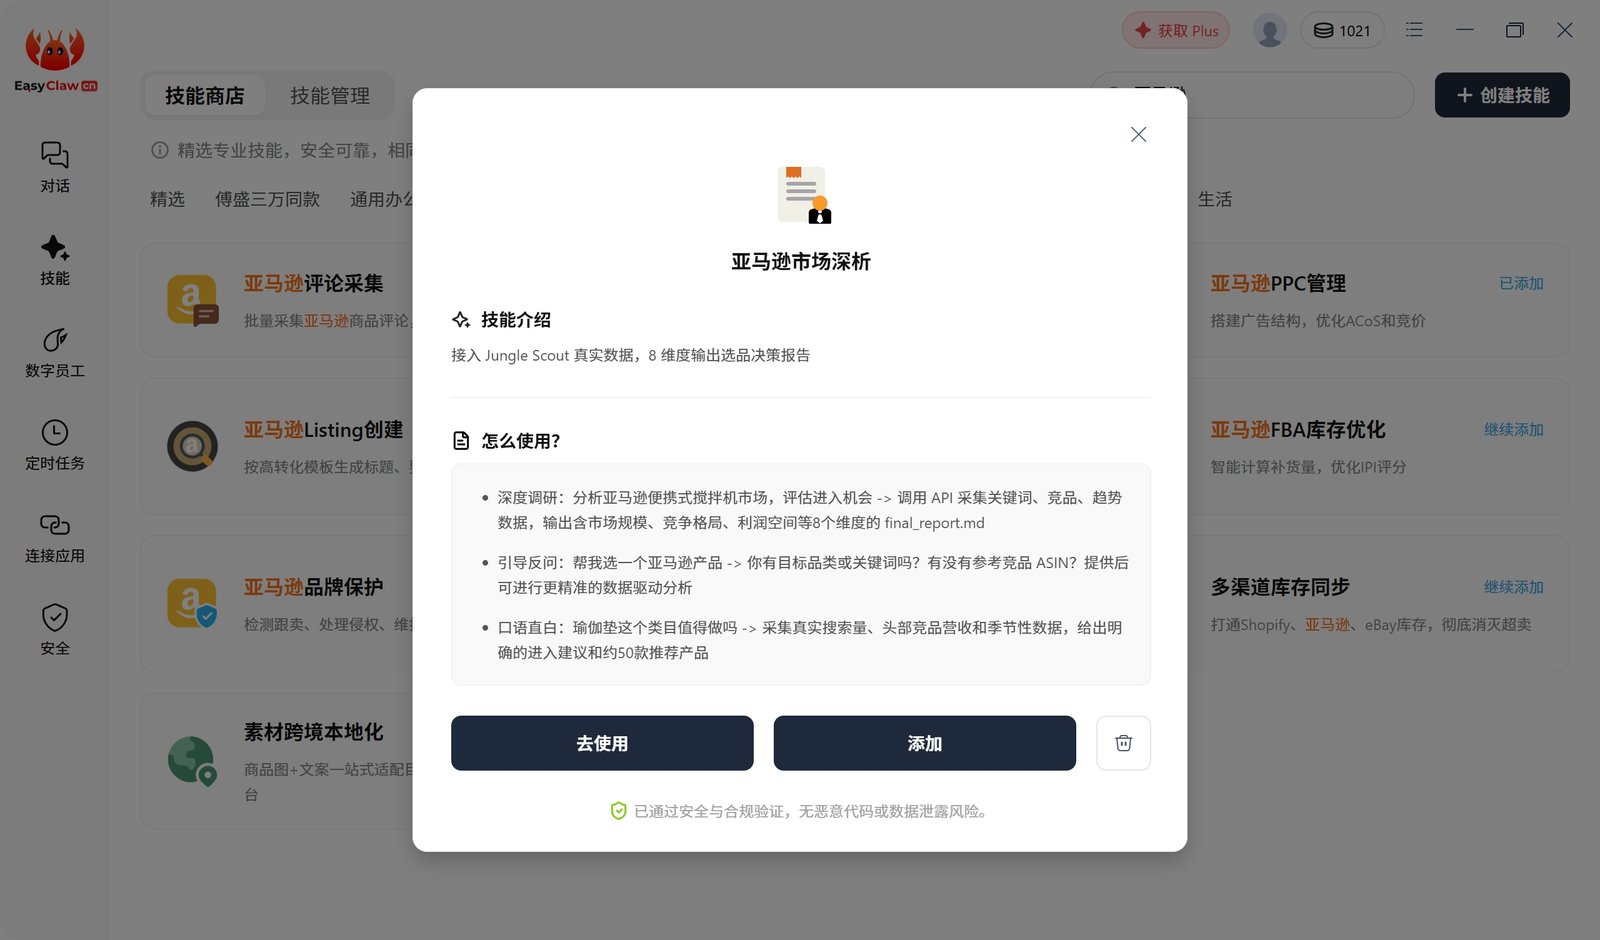
📦 Amazon Market Deep-Dive
Actual capability: calls Jungle Scout's 4 official APIs (keywords_by_keyword / historical_search_volume / product_database / share_of_voice), processes data through an 8-dimension framework, and produces a complete final_report.md + a ~50-product recommendation CSV + 1688 B2B suppliers. Bilingual.
After installing, configure your Jungle Scout API key in EasyClaw (open an account at junglescout.com and grab it from the dashboard). That's the skill's only prerequisite.
EasyClaw automatically invokes the skill and starts the pipeline. The whole process is about 20 conversation turns, during which it asks a few clarifying questions (whether to break down sub-categories, whether to include B2B suppliers, etc.).
When the pipeline finishes, the skill produces a final_report.md directly
The strongest thing about Amazon Market Deep-Dive: it doesn't just give data, it produces a structured research report. Here's a key excerpt from the report it output after running the tumbler category:
# Amazon US Insulated Tumbler Market Research Report
Category analyzed: Insulated Tumbler (Kitchen > Tumblers)
Price range: $20-35
Data date: 2026-05-29, official Jungle Scout API
1. Market Size
- Core keyword monthly search volume:
insulated tumbler 12.4K/tumbler with lid 8.9K/stainless steel tumbler 6.2K - Top seller monthly revenue: about
$185K
2. Competition
- Effective competitors:
~340 - Top5 market share:
38% - Top10 average review count:
1820 - PPC CPC:
$1.45
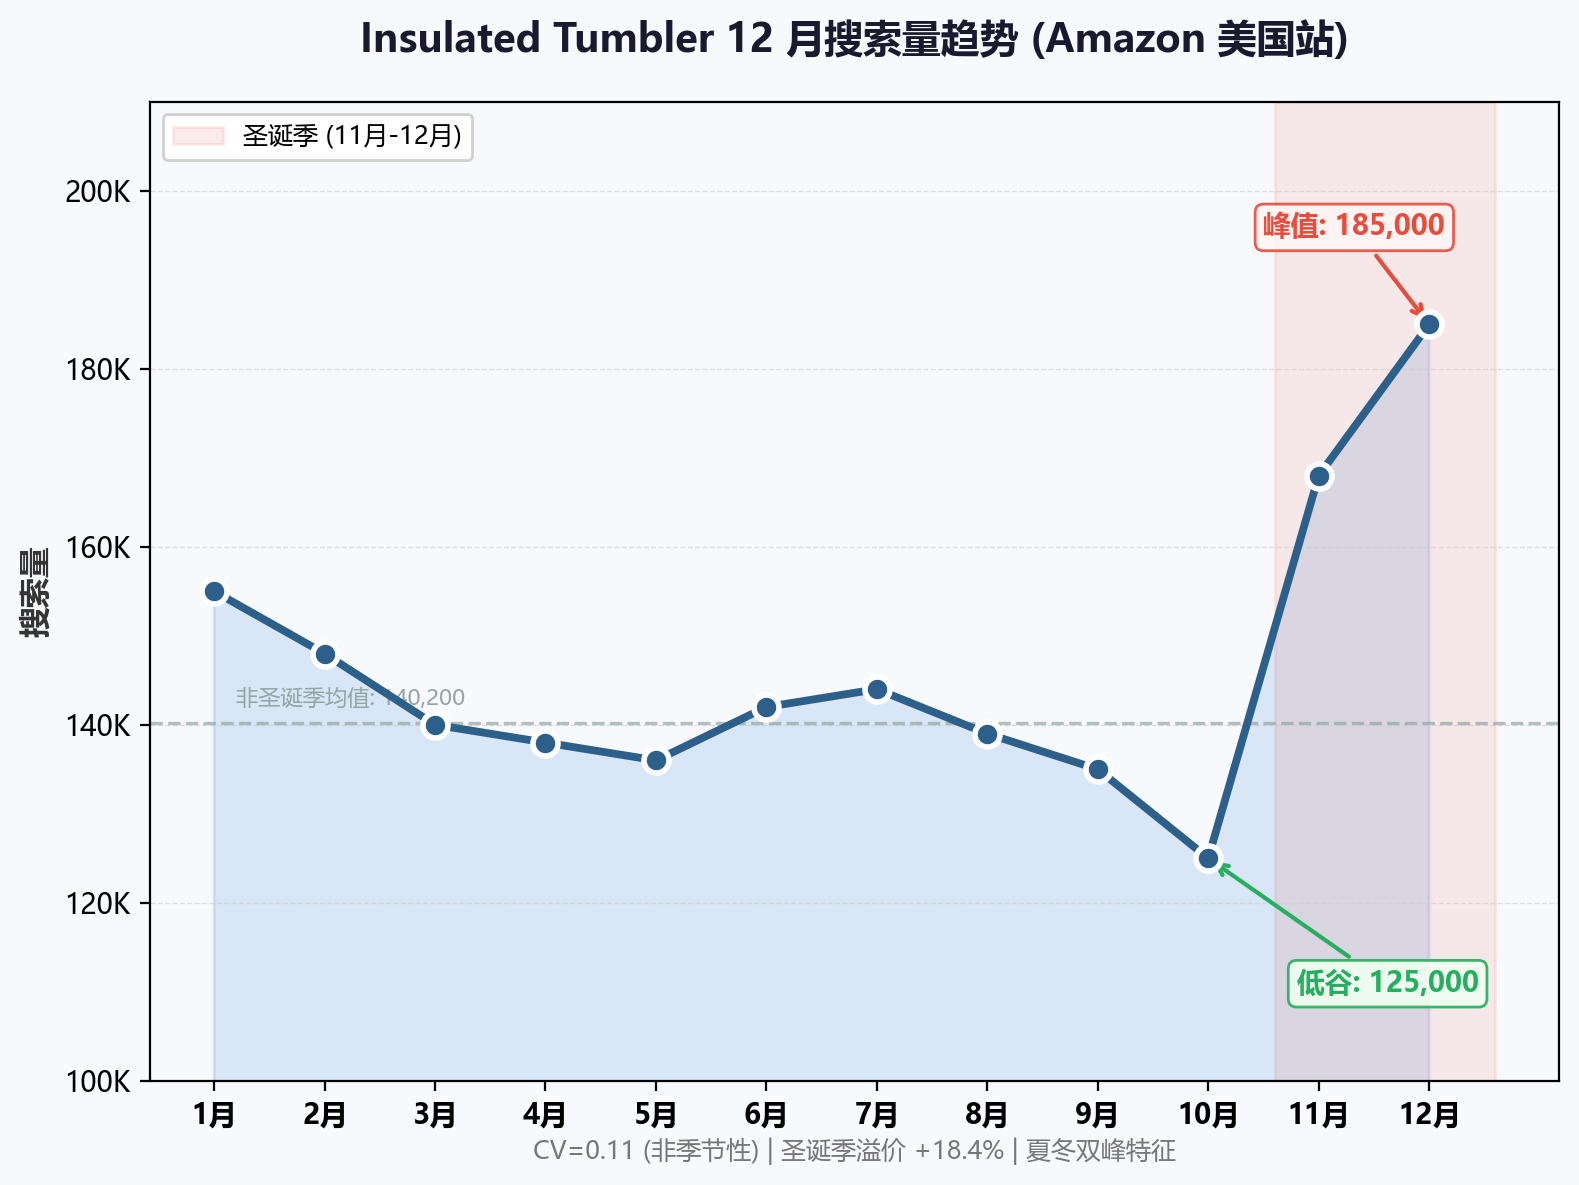
3. Seasonality
- Trailing-12-month weekly search-volume CV:
0.32 - YoY growth:
+8.4%
… the report also includes 4. Profit / 5. Entry barrier / 6. Marketing / 7. Blue-ocean opportunity / 8. Pain points — 8 dimensions + an overall conclusion + a 50-product recommendation table + a B2B supplier list
Here's the key part: how to read this report
The table below is the skill's core standard — note it down and you can use it yourself:
Amazon Market Deep-Dive's built-in quantified standards (core dimensions)
| Metric | Good ✅ | Medium ⚠️ | Bad ❌ |
|---|---|---|---|
| Monthly search volume | >10K (large) | 5K-10K (medium) | <5K (small) |
| Top seller monthly revenue | >$100K | $50K-100K | <$50K |
| Effective competitors | <50 (low) | 50-200 (medium) | >200 (high) |
| Top5 market share | <40% (scattered) | 40-60% (medium) | >60% (monopoly) |
| Top10 average reviews | <500 (opportunity) | 500-1000 (medium) | >1000 (high barrier) |
| PPC CPC | <$1 (cheap) | $1-2 (medium) | >$2 (expensive) |
| Seasonality CV | ≤0.5 (non-seasonal) | — | >0.5 (seasonal) |
| YoY growth | >+10% (growing) | -5%~+10% (stable) | <-5% (declining) |
| DDP as % of price | <30% (good profit) | 30-40% | >40% (risky) |
| MOQ inventory risk | <500 (low) | 500-2000 (medium) | >2000 (high) |
Plugging the tumbler report data into this table:
Overall conclusion7 dims ✅ + 3 dims ⚠️ + 0 dims ❌
The Amazon US tumbler market is viable. Large market size, stable seasonality, healthy profit room, clear blue-ocean opportunity.
But watch 2 core hurdles:
① High review barrier (Top10 average 1820 reviews) — breaking in with pure ads is extremely costly for a new listing. You need a combined play of "differentiated product + early Vine + genuine buyer word-of-mouth."
② Food-grade certification (FDA / LFGB / 304 stainless steel testing) — premium FBA must arrange this in advance; dropship should screen for 1688 supply with compliance reports.
Same conclusion, but two seller types act completely differently
Turn "high review barrier" into your entry logic
Conclusion: this market is worth committing to. But enter via blue-ocean niches like kids tumblers / car cups / mini pocket cups to avoid the review barriers of mature styles. Arrange FDA / LFGB certification in advance, target margin ≥40%.
Next action: after the market → go to Step 2 "Find a niche" → dig deeper within the blue ocean
Treat "high review barrier" as a product-selection filter
Conclusion: market is viable but stay lightweight. No need for niche-finding — list 1688 in-stock items directly and cover traffic with a high volume of SKUs. Filter: 1688 in-stock with compliance report + 4.7+ rating + low return rate.
Next action: after the market → skip niche → go straight to Step 4 "Margin math" → then list
Operator K's pitfall notes
These 4 market-judgment pitfalls trip up beginners most
- Charging in just because search volume is big: 12.4K is a large market, but if Top5 share is 70% + Top10 reviews are all over 10K, a beginner can't break in. You must read all 8 dimensions together, never judge on a single one.
- Ignoring seasonality trends: some categories spike in June from summer-drink demand and halve by October. Amazon Market Deep-Dive computes the CV coefficient — categories with CV > 0.5 need a seasonal stocking plan, or you'll be out of stock in peak and overstocked in the off-season.
- Treating YoY as a magic signal: YoY +8% is solid growth, but check the absolute value. A new small sub-category at YoY +50% but only 2K monthly searches has too small a pie — no matter how fast it grows, it can't support a store.
- Pricing without checking DDP: many beginners compute "price − 1688 cost = profit" and forget FBA's 15% referral + inbound freight + storage + ad spend. Amazon Market Deep-Dive computes DDP as a % of price — be cautious entering categories where DDP > 40%.
Market judged — next, go find a niche
FAQ about Amazon Market Deep-Dive
🤖 Run your full Amazon tumbler workflow with EasyClaw
Product research → sourcing → listing → promotion → operations — every stage has a matching skill.
Install once, ask across the whole chain.