Can Amazon Tumblers Make Money? I Ran Dual-Mode Margin Math with Amazon Market Deep-Dive
Step 4 of product research: the market is judged viable, the kids niche is locked, and the leak-proof seal differentiation is found. The final gate: can this tumbler actually make money?
This step can't be done from gut — you must break down every cost. Counting only the 1688 product cost is the most common beginner mistake. Once you add FBA referral, inbound, storage, ads, and return losses, many seemingly profitable products are actually losing money.
What problem this step actually solves
Margin math looks like arithmetic, but it really answers 3 decision questions:
- ① At the current price and current 1688 quote, does the all-in margin clear the bar? (premium FBA ≥40% / dropship ≥15%)
- ② If not, which cost item has the most room to compress? (negotiate product cost / raise price / cut ad ACoS)
- ③ If it truly can't be squeezed down, drop it or switch models? (premium FBA → dropship testing)
Why I stopped doing the math manually in Excel
Three years ago I managed all SKU margin math in one Excel sheet. Every new product meant looking up 5 tables to fill in data by hand: 1688 cost, sea freight quote, FBA referral, storage rate tables, competitor CPC… 30 minutes per product, 1.5 hours for 3 candidates. The worst part: miss any one item → you only find out you're losing money after you're already operating.
❌ Doing the math manually in Excel
· Fill 5 tables by hand, 30 minutes per product
· Missing storage fees and ad ACoS is the norm
· Many don't know storage fees 4× in peak season
· Return loss estimated from gut
· No "standard" after computing — don't know if the margin is high or low
✅ Using EasyClaw's Amazon Market Deep-Dive
· Uses product_database API to auto-pull competitor pricing + top-seller DDP
· Auto-grades by built-in standard (premium FBA ≥40% / dropship ≥15%)
· Peak storage fees, ad ACoS auto-applied by industry benchmarks
· Computes both modes at once to compare which is more profitable
· 5-8 minutes for a candidate's complete margin math
Why I don't use the SellerAmp calculator — I use EasyClaw
SellerAmp / the FBA Revenue Calculator are common cost-calculation tools. But they don't do the same thing as EasyClaw:
🧮 SellerAmp / FBA calculator
A pure calculator: you must fill in all the data
→ the formula is fine, but it doesn't tell you whether the computed margin is good or bad
The biggest beginner pain:
· You compute a 25% margin but don't know if that's high or low
· Don't know premium FBA should be ≥40%, dropship ≥15%
· Don't know which cost can be cut, or by how much
→ It's a calculator, not a decision tool
🤖 EasyClaw's Amazon Market Deep-Dive (with judgment standards)
Amazon Market Deep-Dive auto-pulls competitor pricing / CPC / top-seller DDP from the JS API:
· No manual entry — the skill pulls real market data
· After computing, it grades by built-in standard (DDP <30% ✅ / 30-40% ⚠️ / >40% ❌)
· Gives both-mode margins at once (premium FBA / dropship compared)
· When it falls short, it tells you the 3 options directly: "cut cost / raise price / drop"
This is a decision tool with "judgment standards," not a plain calculator.
Here's how I had EasyClaw do this
📦 Amazon Market Deep-Dive
The same skill as "Market check" and "Find a niche." This step mainly uses its product_database API (pulling competitor pricing/DDP) + built-in DDP quantified standards.

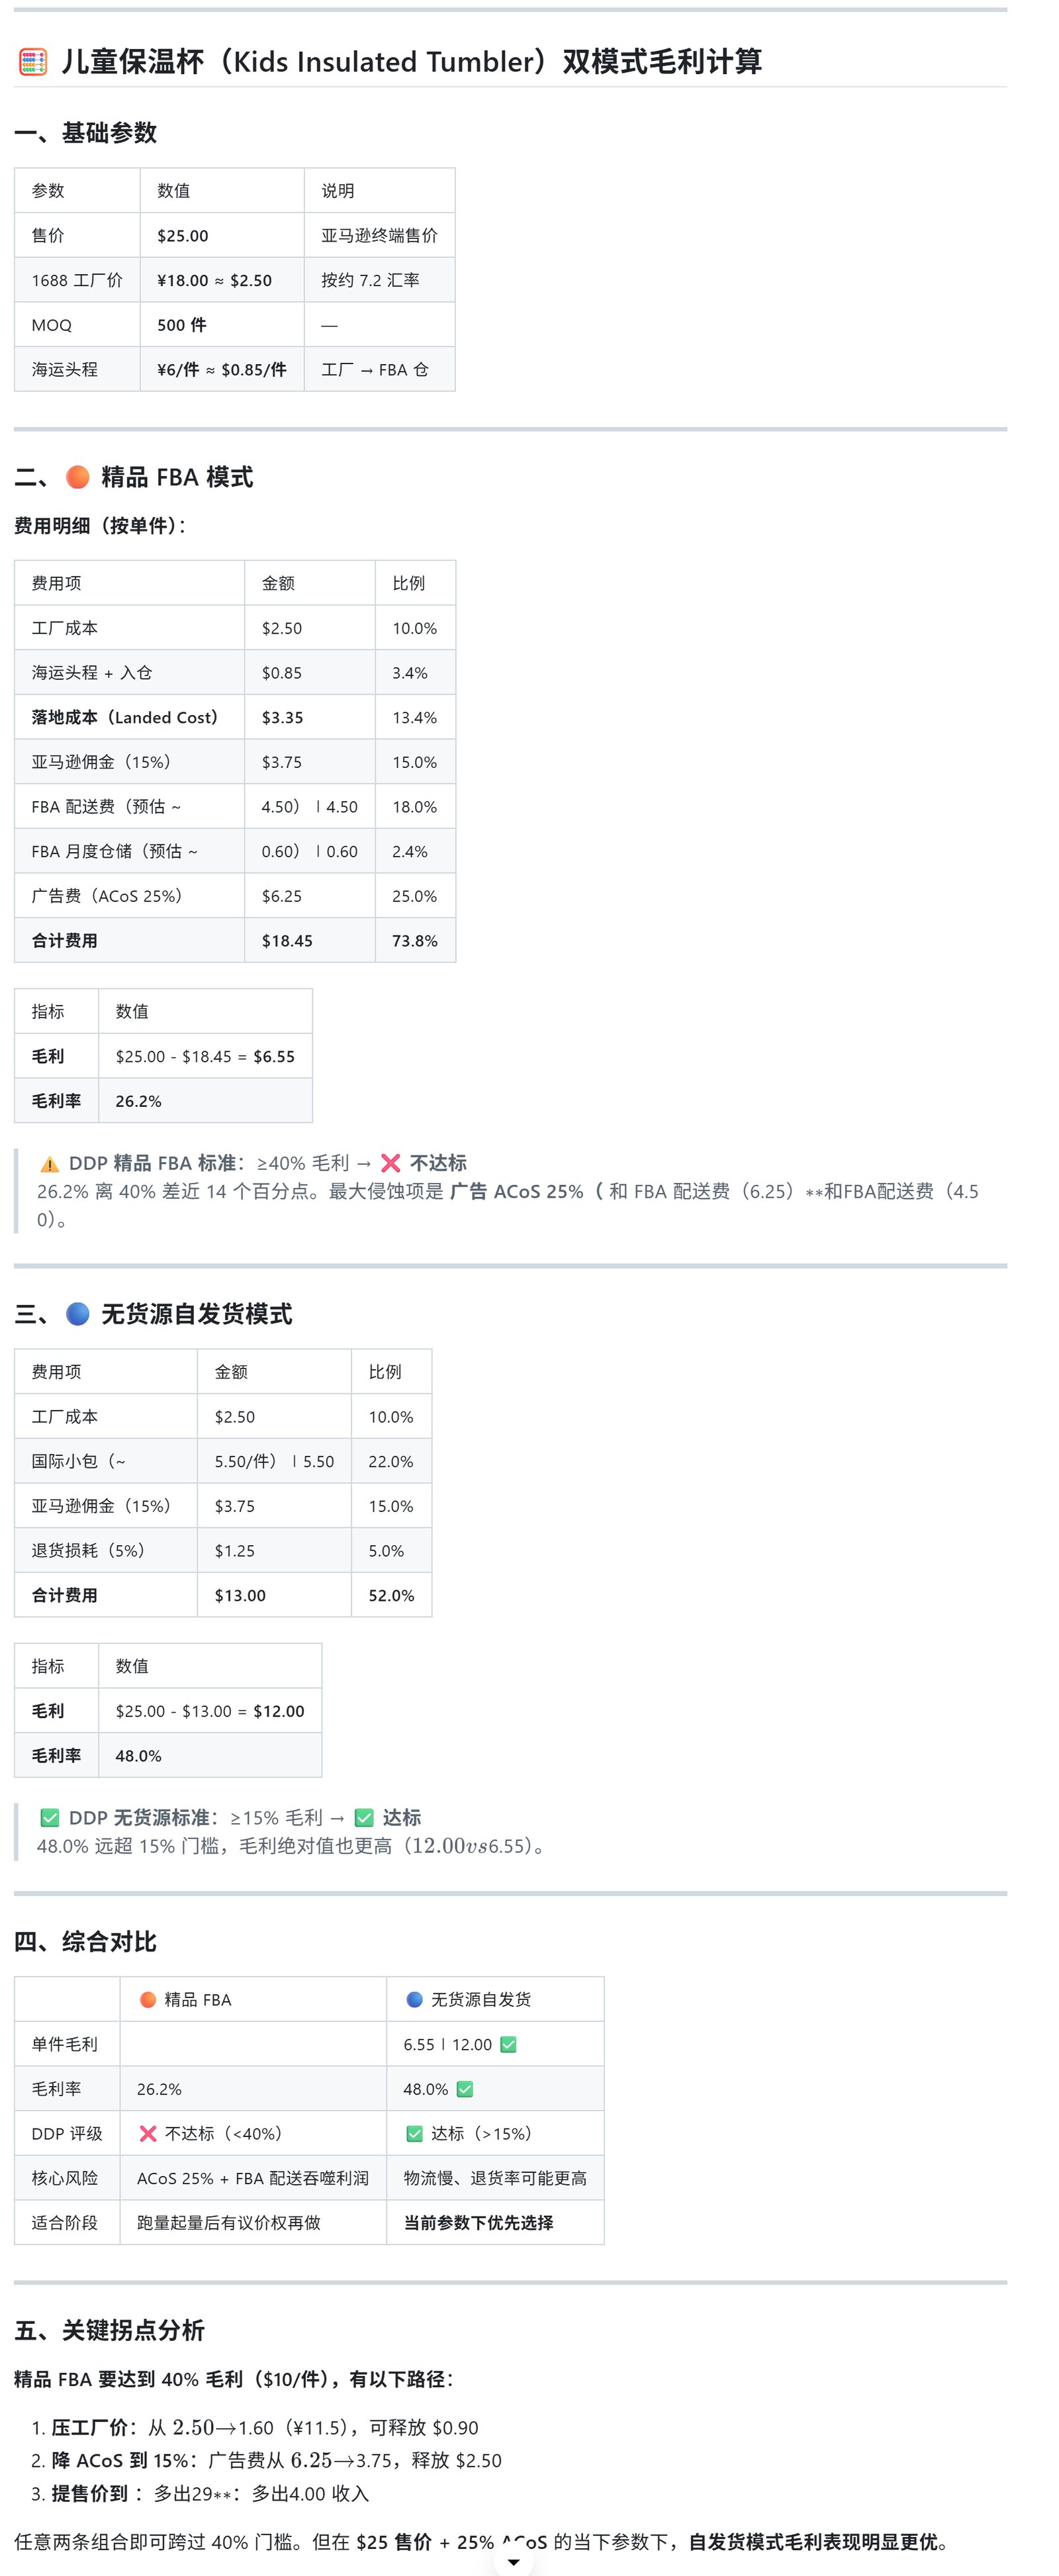
Product parameters:
· Price $25, 1688 factory quote ¥18 (about $2.50)
· Estimated MOQ 500, sea inbound ¥6/unit (about $0.85)
Please compute both the 🟠 premium FBA mode (incl. inbound + prep + referral + FBA fulfillment + storage + ad ACoS 25%) and the 🔵 dropship mode (incl. international parcel + platform referral + return loss 5%) all-in margins.
Grade by DDP-as-%-of-price standard (premium FBA ≥40% margin / dropship ≥15% margin)."
EasyClaw automatically runs the product_database API to pull competitor pricing / DDP industry benchmarks and computes each mode separately.
The dual-mode margin comparison the skill produces
EasyClaw outputs the dual-mode margin calculation (data shape illustrative; final values depend on the skill's actual run):
Private mold + stock + FBA warehouse + Prime traffic
| Item | Amount | % of price |
|---|---|---|
| Price | $25.00 | 100% |
| 1688 cost (¥18) | -$2.50 | 10.0% |
| Sea inbound | -$0.85 | 3.4% |
| FBA prep fee | -$0.30 | 1.2% |
| FBA referral (15%) | -$3.75 | 15.0% |
| FBA fulfillment | -$4.50 | 18.0% |
| Storage (annual avg) | -$0.40 | 1.6% |
| Ad ACoS (25%) | -$6.25 | 25.0% |
| DDP total cost | -$18.55 | 74.2% |
| All-in margin | $6.45 | 25.8% ⚠️ |
❌ Standard ≥40%, current 25.8% falls short → must cut cost or drop
1688 one-piece dropship + international parcel + zero inventory
| Item | Amount | % of price |
|---|---|---|
| Price | $25.00 | 100% |
| 1688 cost | -$2.50 | 10.0% |
| International parcel | -$8.00 | 32.0% |
| Platform referral (15%) | -$3.75 | 15.0% |
| Return loss (5%) | -$1.25 | 5.0% |
| (no FBA inbound / prep / fulfillment / storage / ad fees) | ||
| DDP total cost | -$15.50 | 62.0% |
| All-in margin | $9.50 | 38.0% ✅ |
✅ Standard ≥15%, current 38% far exceeds → approved, ready to list
Here's the key part: how to read "a decision" from this margin math
Don't just look at margin % — look at absolute margin dollars
25.8% × $25 = $6.45/unit (earning $6.5 per order)
Versus 50% × $10 = $5.00/unit (earning $5 per order)
A 50% margin looks high, but the $25 product actually earns more. Look at "margin %" and "margin dollars × monthly sales" together, so the percentage doesn't fool your decision.
Ad ACoS is the biggest variable — compute by the target ACoS
Launch-phase ACoS is usually 30-50% (you need ads to grab organic rank)
Stable-phase ACoS can be compressed to 15-20% (once organic traffic builds)
The math must use the "stable-phase target ACoS" (25% is the industry benchmark), not the current ACoS. The most common beginner mistake: doing the math at launch-phase 50% ACoS, concluding "losing money," and dropping it early — when in fact, once it ramps and ACoS falls to 25%, the margin turns positive.
Storage fees follow volume — compute on a full-year weighted basis
Off-season (Jan-Sep) a tumbler's monthly storage is about $0.40
Peak (Q4 Oct-Dec) is 4× higher at $1.50+
The math must use a full-year 12-month weighted average (about $0.40-0.55/unit/mo), not just Q1 data. → See the full FBA storage-fee rules. My first pitfall was computing at the off-season $0.40, then Q4 storage spiked and ate half the profit.
Stacking the three signals, the margin-math decision conclusion is clear:
Overall decisionChoose dropship to test
🟠 Premium FBA margin 25.8% < 40%: falls short. Three adjustments possible:
- ① Cut the 1688 cost: from ¥18 to ¥14 (→ margin rises to 32%, still short)
- ② Raise the price: from $25 to $32 (→ margin rises to 41%, clears but needs testing for conversion impact)
- ③ Switch to dropship to test: validate the kids style with dropship first, confirm conversion, then return to premium FBA (recommended)
🔵 Dropship margin 38% > 15%: far exceeds, approved.
Final decision: test with dropship for 3 months first, then move to premium FBA for brand depth once proven.
Same numbers, two seller paths completely different
Must cut cost to ≥40% margin before committing
Current 25.8% falls short → must pick 1 of 3: ① find a factory to cut cost (compare on Alibaba, target ¥14) / ② raise the price (needs a differentiated selling point to support it) / ③ cut ACoS (improve listing conversion to indirectly lower ad spend).
Next action: cost-cutting plan → sourcing (find a cheaper factory) → re-run the math
Margin already clears — move to sourcing
38% margin far exceeds the 15% standard → approved, move straight to the next stage: source in-stock styles on 1688 to list. Filter 1688 supply by three conditions: kids tumbler + leak-proof seal + 4.7+ rating.
Next action: approved → sourcing (1688 in-stock styles) → list and test
Operator K's pitfall notes
These 5 margin-math pitfalls trip up beginners most
- Always compute the stable-phase ACoS, not the current CPC: launch-phase 50% ACoS looks like a total loss, but stable-phase drops to 20%. Do the math for the long term; don't be scared off by startup-phase data.
- Weight storage fees over the full year, not just Q1: Q4 storage fees going 4× is common knowledge, but 90% of beginners don't know it. 1000 units × Q4's 3 peak months could be $400+ in storage — you must use a full-year weighted figure to be accurate.
- 5% return loss is the floor; poor-quality styles hit 10%: 1688 in-stock quality varies, and early return rates are often 8-12%. A 5% return loss in the math is optimistic — leave an 8% safety cushion.
- 1688 quotes are "non-promotional" — remember to negotiate 15-20% off: 1688 sellers' listed prices usually leave room to bargain. Contact factories starting at MOQ 500 and negotiating 15-20% off is routine. ¥18 → ¥14.4 is very achievable.
- Price-elasticity test: can you add $3 without hurting conversion? If your product has real differentiation (leak-proof seal), adding $3 ($25 → $28) usually won't significantly hurt conversion and directly lifts margin by 6%+. This is the "margin-boost" lever beginners most overlook.
The margin math is done — product research is fully complete
FAQ about margin math
🤖 Run your full Amazon tumbler workflow with EasyClaw
Product research → sourcing → listing → promotion → operations — every stage has a matching skill.
Install once, ask across the whole chain.